

In this Edition:
MARKET MOVES OF THE WEEK
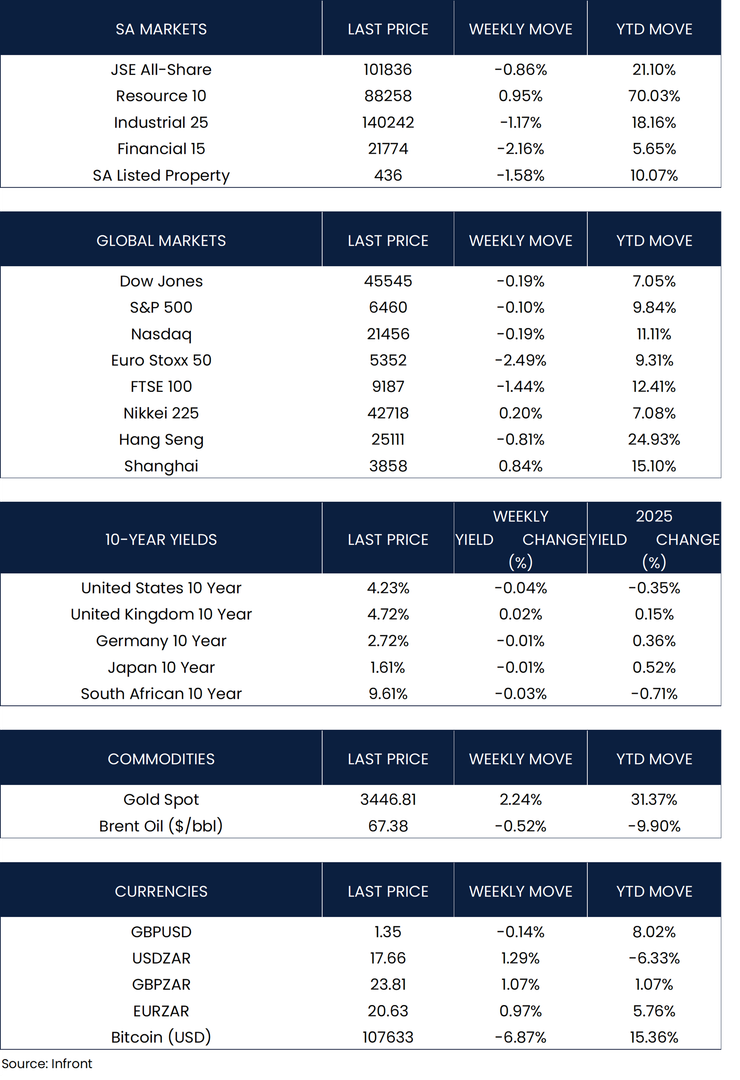
CHART OF THE WEEK
In this Edition:
Strong Growth with Policy and Trade Tensions
AI investment jumped, while Trump’s move against a Fed governor raised independence concerns.
Divided Outlook and Consumer Weakness
Retail sales in the UK have now fallen for 11 consecutive months, marking the longest downturn in years.
China’s Weakness Drives Stimulus Expectations
Industrial profits fell 1.5% in July, less than expected, but broad indicators point to further stimulus ahead.
Mixed but Cautious Performance
The STOXX Europe 50 fell 2.49%, weighed by tariff tensions and political instability in France.
Rising Costs but Trade Surplus Support
July’s Producer Price Index rose to 1.5%, while a R20.3 billion trade surplus was recorded.
Market Moves & Chart of the Week
Strong Growth with Policy and Trade Tensions
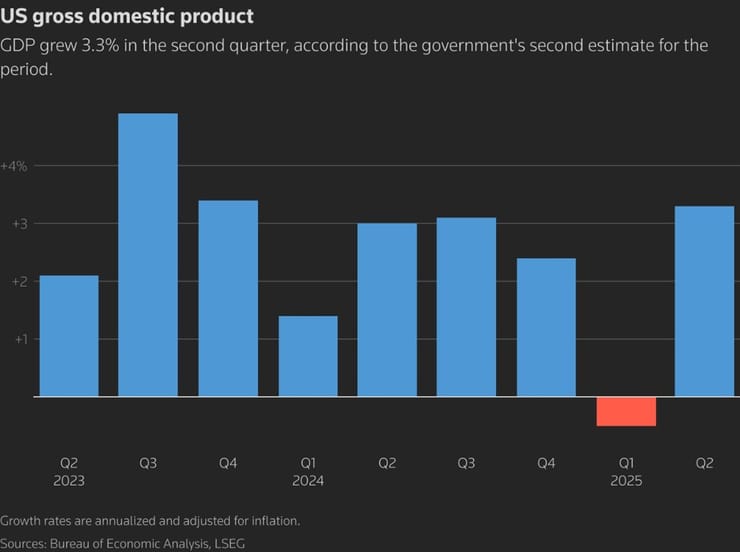
The U.S. economy expanded at a stronger-than-expected pace in Q2, with GDP revised up to 3.3% annualised from the initial 3.0% estimate. The revision was largely driven by robust business investment in intellectual property—particularly in areas such as artificial intelligence, which grew at a 12.8% rate, the fastest in four years. While consumers and businesses have so far held up against tariff-related volatility, ongoing trade pressures continue to cloud the outlook.
U.S. inflation edged higher in July, with the broader PCE index rising 2.6% year-on-year and 0.2% month-on-month. Core PCE, which excludes volatile food and energy components and is the Federal Reserve’s preferred measure, increased 2.9% annually and 0.3% for the month. While broadly in line with expectations, the data suggest underlying price pressures remain sticky, supporting the view that the Fed will approach further rate cuts cautiously, and indicating that tariffs are beginning to feed through the U.S. economy.
President Donald Trump announced last week that he had fired Federal Reserve Governor Lisa Cook, citing allegations of mortgage fraud, though the legality of his action is now under review. Cook has sued, arguing the President lacks the authority to remove her from office, and a federal judge has yet to rule on whether the dismissal will stand. While the attempt raised concerns over Fed independence, market reaction was muted.
The U.S. has raised tariffs on most Indian imports to 50%, doubling the previous rate and extending them to sectors including garments, jewellery, seafood, and furniture. The decision, effective 27 August, is linked to India’s ongoing purchases of Russian oil, which Washington argues help fund the Ukraine war and undermine sanctions. Analysts estimate the tariffs could cut India’s export earnings by over $35 billion and weigh on growth, while also straining trade ties between the two countries.
Divided Outlook and Consumer Weakness
European Central Bank (ECB) policymakers kept the deposit facility rate at 2.0% in July, but meeting minutes revealed a split over inflation risks. Some members pointed to weaker growth, U.S. tariffs, and a stronger euro as downside pressures, while others highlighted energy prices and currency volatility as potential upside risks. President Christine Lagarde said U.S. tariffs are having only a limited effect on eurozone growth as firms adjust. Speaking at the Jackson Hole symposium, ECB officials signalled that a September rate cut is unlikely, though further easing could be considered later in the year if economic momentum slows.
In the UK, retail sales volumes weakened for an 11th consecutive month in August. Meanwhile, shops raised prices by the most since the end of 2023, according to the Confederation of British Industry distributive trades survey.
China’s Weakness Drives Stimulus Expectations
China’s industrial profits fell 1.5% in July, a smaller decline than expected, as strong tech sector earnings offset weakness in industries facing soft demand and deflationary pressures. Other data released earlier in the month showed slowing momentum, with retail sales, factory activity, and fixed-asset investment all underperforming. Economists anticipate the slowdown will persist in the coming months, likely prompting additional stimulus measures, possibly as soon as September.
In Asia, Japan’s Nikkei 225 advanced 0.20%, and mainland Chinese equities extended their recent rally, with the Shanghai Composite up 0.84%, largely driven by ample domestic liquidity rather than stronger economic fundamentals. Conversely, Hong Kong’s Hang Seng Index lost 0.81%
Mixed but Cautious Performance
U.S. equity markets ended last week slightly lower on light trading volumes, with the Dow Jones and Nasdaq Composite each down 0.19% and the S&P 500 slipping 0.10%. In Europe, the STOXX Europe 50 fell 2.49%, weighed down by renewed tariff uncertainty, political instability in France, and ongoing tensions between Russia and Ukraine, while the UK’s FTSE 100 declined 1.44%.
Rising Costs but Trade Surplus Support
South Africa’s Producer Price Index (PPI) rose sharply to 1.5% in July 2025, up from 0.6% in June, according to Statistics SA, highlighting notable increases in domestic production costs. Meanwhile, the country recorded a preliminary trade surplus of R20.3 billion in July, driven by exports of R184.3 billion against imports of R164.0 billion, slightly below June’s revised surplus of R21.0 billion.
The JSE All-Share Index posted modest losses the previous week, declining 0.86%, primarily due to weakness in the Financial sector (-2.16%). Listed property (-1.58%) and the Industrial sector (-1.17%) also weighed on performance, while gains in the Resource sector (+0.95%) partially offset the slide. The rand weakened 1.29% against the U.S. dollar, ending the week at R17.66/USD.
U.S. GDP grew at a 3.3% annualized rate in Q2, revised up from 3.0 according to the BEA. The rebound follows a 0.5% contraction in Q1, when front-loaded imports ahead of tariffs weighed on growth.
The information contained in this recording/presentation is for general information purposes only and should not be construed as, nor does it constitute financial, tax, legal, investment or any other advice. Carrick does not guarantee the suitability or potential value of any products or investments discussed herein. We make no representations or warranties of any kind, express or implied, about the completeness, accuracy, reliability, suitability or availability with respect to the information, products, services, or any other content contained in this recording for any purpose. Carrick accepts no responsibility for the suitability or accuracy of the information or for any errors or omissions that may occur. Therefore, any reliance you place on such information is strictly at your own risk. This material is provided for general information purposes only and is not personal advice to anyone to invest in any fund or product. Information taken from trade and other sources is believed to be reliable, although Carrick does not represent this as accurate or complete and it shouldn’t be relied upon as such. All material, content, and information provided by Carrick is the intellectual property of Carrick Group and its affiliates, unless otherwise stated. No part of this material may be copied, reproduced, distributed, published, or used for any commercial purpose without Carrick’s prior written consent, and is provided solely for non-commercial use. Capital is at risk. The value and income from investments can go down as well as up and are not guaranteed. An investor may get back significantly less than they invest. Past performance is not a reliable indicator of current or future performance and should not be the sole factor considered when selecting an investment.