
In this Edition:
MARKET MOVES OF THE WEEK
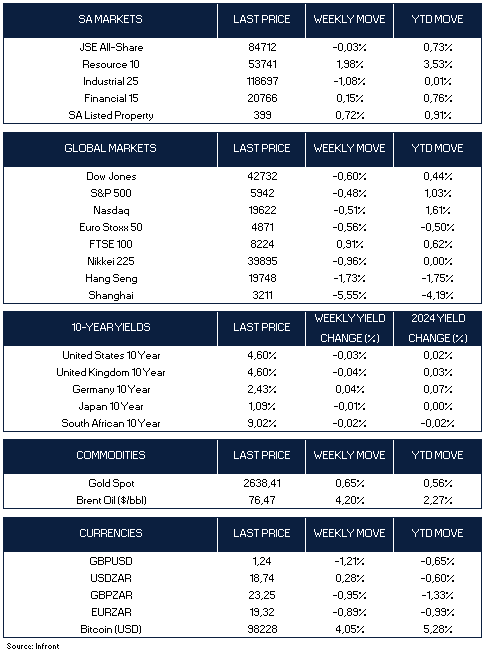
CHART OF THE WEEK
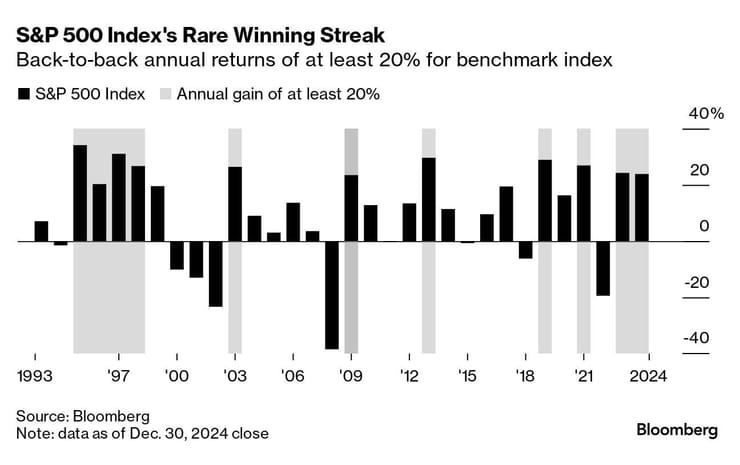
The S&P 500 Index gained 23% in 2024, capping the strongest back-to-back annual run since the dot-com bubble of the late 1990s. Much of the boost to the benchmark index has come from the so-called Magnificent Seven stocks that have rallied about 69% this year, after more than doubling in 2023. Source: Bloomberg
Major stock indexes showed mixed performance during the holiday-shortened week, though a strong rally on Friday helped mitigate earlier losses. For 2024, the S&P 500 (-0.48% w/w) posted its second consecutive annual gain of over 20%, marking the best two-year performance in 25 years. The Nasdaq Composite (-0.51% w/w) also ended the year with over a 20% increase, achieving this milestone for the sixth time in the past eight years.
U.S. manufacturing showed signs of recovery in December with production bouncing back and new orders continuing to rise. However, the overall outlook remains unclear, with concerns about the potential impact of higher tariffs on imported raw materials, which could drive up costs.
Despite the increase in the Institute for Supply Management’s (ISM) Purchasing Managers Index (PMI) to a nine-month high, the mood in the survey was mixed. Several respondents highlighted challenges, using terms like “volume decreases” and “significant slowdown.” Notably, none of the six largest manufacturing sectors showed growth during the month.
In Europe, the Euro Stoxx 50 fell 0.56% over the week on light news flow. The UK’s FTSE 100 Index, on the other hand, rose 0.91%. A weaker British pound versus the U.S. dollar helped support the index, which includes many multinational companies that generate revenue overseas.
Japan’s stock markets closed lower in a holiday-shortened week, following signs of profit-taking. On the final trading day of 2024, the Nikkei 225 Index dropped nearly 1%, ending at a record high of 39,895. The benchmark still posted an impressive annual gain of almost 20%, driven by factors such as share buybacks, corporate governance reforms, and a weaker yen, which benefited exporters.
Chinese stocks fell as weaker-than-expected manufacturing data dampened investor sentiment. The Shanghai Composite Index dropped 5.55% w/w, while Hong Kong’s Hang Seng Index slipped 1.73%. China’s factory activity grew for the third consecutive month, though the official manufacturing PMI slowed to 50.1 in December, missing expectations. The non-manufacturing PMI, covering services and construction, rose to 52.2, surpassing forecasts.
Gold prices (+0.65% w/w) hit a three-week high, supported by a softer dollar and safe-haven buying. In other commodities, Brent oil rose by 4.20% over the week.
The South African rand has emerged as one of the top five performing emerging market currencies in 2024, for the first time since 2016, according to analysts at Crédit Agricole and Ashmore Group. Despite a sharp drop in December that pushed its 2024 performance to a circa 2% decline against the U.S. dollar, it still ranks fifth among 24 major developing-nation currencies tracked by Bloomberg, following the Malaysian ringgit, Hong Kong dollar, Thai baht, and Peruvian sol.
Fixed-investment projects in South Africa surged to R794 billion in 2024 from R193 billion the previous year, according to Crédit Agricole. The growth reflects progress in infrastructure and energy reforms, including public-private partnerships at the nation’s largest port. Improved reliability from electricity provider Eskom also supported increased economic activity.
The All-Share Index dipped by 0.03% this week, driven by losses in Industrials (-1.08%). The local currency weakened against the U.S. dollar, moving to R18.74/$ from last week’s R18.68/$ level. SA government bonds remained relatively stable, as yields on the 10-year fell 0.02% over the week.
The information contained in this recording/presentation is for general information purposes only and should not be construed as, nor does it constitute financial, tax, legal, investment or any other advice. Carrick does not guarantee the suitability or potential value of any products or investments discussed herein. We make no representations or warranties of any kind, express or implied, about the completeness, accuracy, reliability, suitability or availability with respect to the information, products, services, or any other content contained in this recording for any purpose. Carrick accepts no responsibility for the suitability or accuracy of the information or for any errors or omissions that may occur. Therefore, any reliance you place on such information is strictly at your own risk. This material is provided for general information purposes only and is not personal advice to anyone to invest in any fund or product. Information taken from trade and other sources is believed to be reliable, although Carrick does not represent this as accurate or complete and it shouldn’t be relied upon as such. All material, content, and information provided by Carrick is the intellectual property of Carrick Group and its affiliates, unless otherwise stated. No part of this material may be copied, reproduced, distributed, published, or used for any commercial purpose without Carrick’s prior written consent, and is provided solely for non-commercial use. Capital is at risk. The value and income from investments can go down as well as up and are not guaranteed. An investor may get back significantly less than they invest. Past performance is not a reliable indicator of current or future performance and should not be the sole factor considered when selecting an investment.